Build a Tile-Based Google Map with JavaScript
Ever wondered how Google Maps loads and zooms so smoothly? While their full system is massively complex, the fundamental idea behind map display is surprisingly approachable.
In this post, we'll walk through the process of building a very basic tile-based map display library - just enough to understand how tiled maps work, including zoom and pan behavior.
Introducing the Tile System
Modern web-based maps like Google Maps and OpenStreetMap use a tile-based system to display the world at various zoom levels. The core concept is simple:
- The map is split into square tiles, usually 256×256 pixels.
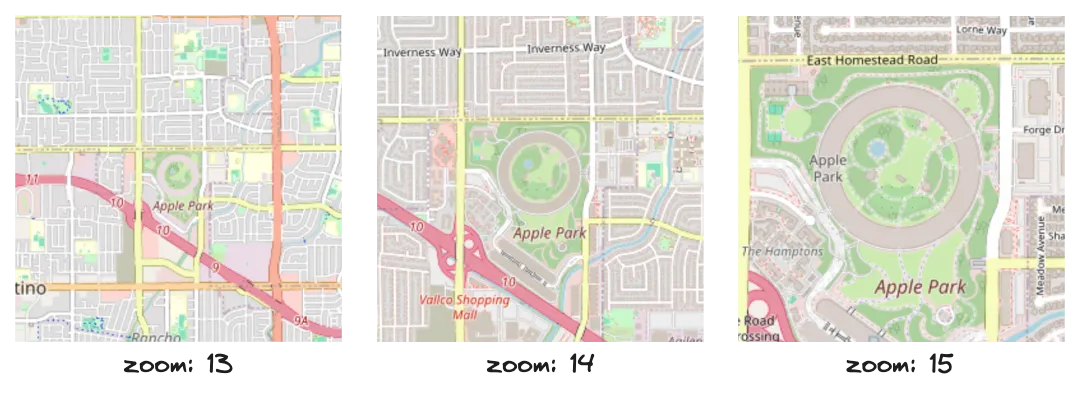
- At zoom level 0, the entire world fits into one tile.
- Each higher zoom level doubles the resolution, making the grid size 2ⁿ × 2ⁿ tiles.
- These tiles are pre-rendered images and fetched dynamically based on the user's view.
This approach allows for efficient loading, smooth panning, and zooming at different scales. The URL format for a tile is:
https://tile.openstreetmap.org/{z}/{x}/{y}.png
Where:
zis the zoom levelxandyare the tile column and row indexes at that zoom level
Calculating Tile Coordinates from Latitude and Longitude
To display a map centered at a specific location, we need to convert geographic coordinates (latitude and longitude) into tile coordinates.
Here's how it's done using the Web Mercator projection:
function latLngToTile(lat, lng, zoom) {
  const x = ((lng + 180) / 360) * Math.pow(2, zoom);
  const y =
    ((1 -
      Math.log(
        Math.tan((lat * Math.PI) / 180) + 1 / Math.cos((lat * Math.PI) / 180)
      ) /
        Math.PI) /
      2) *
    Math.pow(2, zoom);
  return { x, y };
}
This gives you a floating-point tile coordinate. For rendering, you typically round or floor these values to get the tile index.